|
Addgene inc
pbabe egfr Pbabe Egfr, supplied by Addgene inc, used in various techniques. Bioz Stars score: 93/100, based on 1 PubMed citations. ZERO BIAS - scores, article reviews, protocol conditions and more https://www.bioz.com/result/pbabe egfr/product/Addgene inc Average 93 stars, based on 1 article reviews
pbabe egfr - by Bioz Stars,
2026-02
93/100 stars
|
Buy from Supplier |
|
Addgene inc
pbabe egfr l858r t790m plasmid Pbabe Egfr L858r T790m Plasmid, supplied by Addgene inc, used in various techniques. Bioz Stars score: 93/100, based on 1 PubMed citations. ZERO BIAS - scores, article reviews, protocol conditions and more https://www.bioz.com/result/pbabe egfr l858r t790m plasmid/product/Addgene inc Average 93 stars, based on 1 article reviews
pbabe egfr l858r t790m plasmid - by Bioz Stars,
2026-02
93/100 stars
|
Buy from Supplier |
|
Addgene inc
exon5 chr14 Exon5 Chr14, supplied by Addgene inc, used in various techniques. Bioz Stars score: 92/100, based on 1 PubMed citations. ZERO BIAS - scores, article reviews, protocol conditions and more https://www.bioz.com/result/exon5 chr14/product/Addgene inc Average 92 stars, based on 1 article reviews
exon5 chr14 - by Bioz Stars,
2026-02
92/100 stars
|
Buy from Supplier |
|
Addgene inc
pbabe egfr del1  Pbabe Egfr Del1, supplied by Addgene inc, used in various techniques. Bioz Stars score: 93/100, based on 1 PubMed citations. ZERO BIAS - scores, article reviews, protocol conditions and more https://www.bioz.com/result/pbabe egfr del1/product/Addgene inc Average 93 stars, based on 1 article reviews
pbabe egfr del1 - by Bioz Stars,
2026-02
93/100 stars
|
Buy from Supplier |
|
Addgene inc
pbabe egfr del ex19 t790m ![Lamellarin (Lam)14 reduces the viability of Ba/F3 cells expressing epidermal growth factor receptors (EGFRs) with in‐frame deletion within exon 19 (del <t>ex19)/T790M</t> or del ex19/T790M/C797S EGFR‐tyrosine kinase inhibitor‐resistant mutations. A‐C, MTT assay was used to determine the viability of Ba/F3 cells expressing WT or mutant EGFRs treated with Lam14 or osimertinib for 4 days in the presence or absence of interleukin‐3 (IL‐3; 10 ng/mL). Ba/F3 cells expressing del ex19/T790M or del ex19/T790M/C797S EGFR mutations were treated with the indicated concentration of osimertinib (A) or Lam14 (B) in the presence or absence of IL‐3 (10 ng/mL) (mean ± SD [n ≥ 3]). C, IC 50 values of osimertinib and Lam14 in Ba/F3 cell lines are indicated. ND, not determined. D, Ba/F3 cells expressing WT EGFR or Ba/F3 del ex19/T790M/C797S cells were treated with the indicated concentration of Lam14 in the presence or absence of IL‐3 (10 ng/mL) (mean ± SD [n = 3]). In Ba/F3 WT cells, EGF (10 ng/mL) was added instead of IL‐3](https://pub-med-central-images-cdn.bioz.com/pub_med_central_ids_ending_with_8975/pmc08088975/pmc08088975__CAS-112-1963-g004.jpg) Pbabe Egfr Del Ex19 T790m, supplied by Addgene inc, used in various techniques. Bioz Stars score: 90/100, based on 1 PubMed citations. ZERO BIAS - scores, article reviews, protocol conditions and more https://www.bioz.com/result/pbabe egfr del ex19 t790m/product/Addgene inc Average 90 stars, based on 1 article reviews
pbabe egfr del ex19 t790m - by Bioz Stars,
2026-02
90/100 stars
|
Buy from Supplier |
|
Addgene inc
type egfr  Type Egfr, supplied by Addgene inc, used in various techniques. Bioz Stars score: 93/100, based on 1 PubMed citations. ZERO BIAS - scores, article reviews, protocol conditions and more https://www.bioz.com/result/type egfr/product/Addgene inc Average 93 stars, based on 1 article reviews
type egfr - by Bioz Stars,
2026-02
93/100 stars
|
Buy from Supplier |
|
Cell Biolabs Inc
pbabe-egfr mutants Pbabe Egfr Mutants, supplied by Cell Biolabs Inc, used in various techniques. Bioz Stars score: 90/100, based on 1 PubMed citations. ZERO BIAS - scores, article reviews, protocol conditions and more https://www.bioz.com/result/pbabe-egfr mutants/product/Cell Biolabs Inc Average 90 stars, based on 1 article reviews
pbabe-egfr mutants - by Bioz Stars,
2026-02
90/100 stars
|
Buy from Supplier |
Image Search Results
Journal: bioRxiv
Article Title: Prolonging lung cancer response to EGFR inhibition by targeting the selective advantage of resistant cells
doi: 10.1101/2023.06.19.545595
Figure Lengend Snippet: A. Cell viability assay of PC9 cells treated for 5 days with pemetrexed (100, 50 or 10 nM; Pem) and gefitinib (1 µM; Gef), alone or in combination. The fraction of viable cells was measured by CellTiter-Glo and normalized to the DMSO treated control. The mean ± SEM (n=6) of one representative of three independent experiments is shown. B. A mass population of PC9 cells containing a small pool of cells bearing the EGFR-T790M mutation generated by CRISPR-barcoding was treated with gefitinib (1 µM) alone or in combination with pemetrexed (50 nM) for 6 days. The proportion of EGFR-T790M cells was assessed by qPCR from genomic DNA and normalized using EGFR_Ctrl primers. Mean ± SEM (n=4) of one representative of three independent experiments. *p < 0.05 (Mann-Whitney test). C. Violin plot illustrating the EGFR-score difference between responders (R) and non-responders (NR) from a cohort of renal cell carcinoma patients treated with sorafenib. The EGFR-score was calculated based on the transcriptomic profiles of the tumors before the treatment. The p value was estimated by using the Student t-test. D. PC9, HCC4006 or HCC827 NSCLC cells containing EGFR-T790M-mutant subpopulations generated by CRISPR barcoding were treated with gefitinib (1 µM) alone or in combination with sorafenib (5 µM; Soraf) for 5 days and the proportion of EGFR-T790M cells was assessed as in B. Mean ± SEM (n=4) of one representative of at least three independent experiments. *p < 0.05 and **p < 0.01 (Mann-Whitney test). E. PC9 and H1975 cells and YU-1150 patient-derived cells (PDC) containing EGFR-C797S-subpopulations were treated with osimertinib (0,1 µM, Osim) alone or in combination with sorafenib (5 µM) for 10 days and the proportion of EGFR-C797S-barcoded cells was measured. Mean ± SEM (n=4) of one representative of at least three independent experiments. F. PC9 and H1975 cells described in E were treated with osimertinib alone (1 µM for PC9 cells, 0,1 µM for H1975 cells) or in combination with sorafenib (5 µM) for 20 days (PC9 cells) or 15 days (H1975 cells). The cells were then fixed and stained with crystal violet. G. Effects of osimertinib alone (0,1 µM) or in combination with sorafenib (5 µM), sunitinib (1 µM; Sun), regorafenib (2 µM; Reg), lenvatinib (1 µM; Lenv) or cabozantinib (5 µM; Cab) in EGFR-C797S-CRISPR-barcoded PC9 cells. The cells were treated for 7 (left panel) or 10 (right panel) days, and the proportion of the EGFR-C797S subpopulation was measured by qPCR. The mean ± SEM (n=5 or n=4) of one representative of three experiments is shown. H. Cell viability of parental or osimertinib-resistant (OR-PC9, EGFR-T790M/C797S) PC9 cells treated for 5 days as indicated with osimertinib (0,1 µM), sorafenib (5 µM), sunitinib (1 µM) or cabozantinib (5 µM). I. Colony forming assay representative images of parental, gefitinib-resistant/osimertinib-sensitive (GR-PC9, EGFR-T790M) or osimertinib-resistant PC9 cells treated for 5 days with osimertinib (1 µM) or sorafenib (5 µM), alone or in combination. J. Diagram representing the effects of the indicated treatments on a mixed population of EGFR-TKI-sensitive (yellow) and EGFR-TKI-resistant (red) NSCLC cells. K. The KRAS-G12D mutation was inserted by CRISPR-barcoding in a subpopulation of H358 cells, and the cells were treated with or without sotorasib (10 nM; Sotor), alone or in combination with sorafenib (5 μM) for 12 days. The proportion of the mutant barcode was assessed by qPCR from genomic DNA and normalized using EGFR_Ctrl primers. Mean ±SEM (n=4) of one representative of three experiments. L. Colony forming assay representative images of parental or KRAS-G12D bearing, sotorasib-resistant (SR) H358 cells treated for 8 days with sotorasib (10 nM) or sorafenib (5 µM), alone or in combination.
Article Snippet: Flag-tagged wt and Ex19Del human EGFR constructs in the lentiviral VIRSP vector were generated by PCR with Herculase II Fusion DNA Polymerase (Agilent technologies) from EGFR WT (a gift from Matthew Meyerson, Addgene plasmid # 11011) ( ) and
Techniques: Viability Assay, Control, Mutagenesis, Generated, CRISPR, MANN-WHITNEY, Derivative Assay, Staining
Journal: bioRxiv
Article Title: Prolonging lung cancer response to EGFR inhibition by targeting the selective advantage of resistant cells
doi: 10.1101/2023.06.19.545595
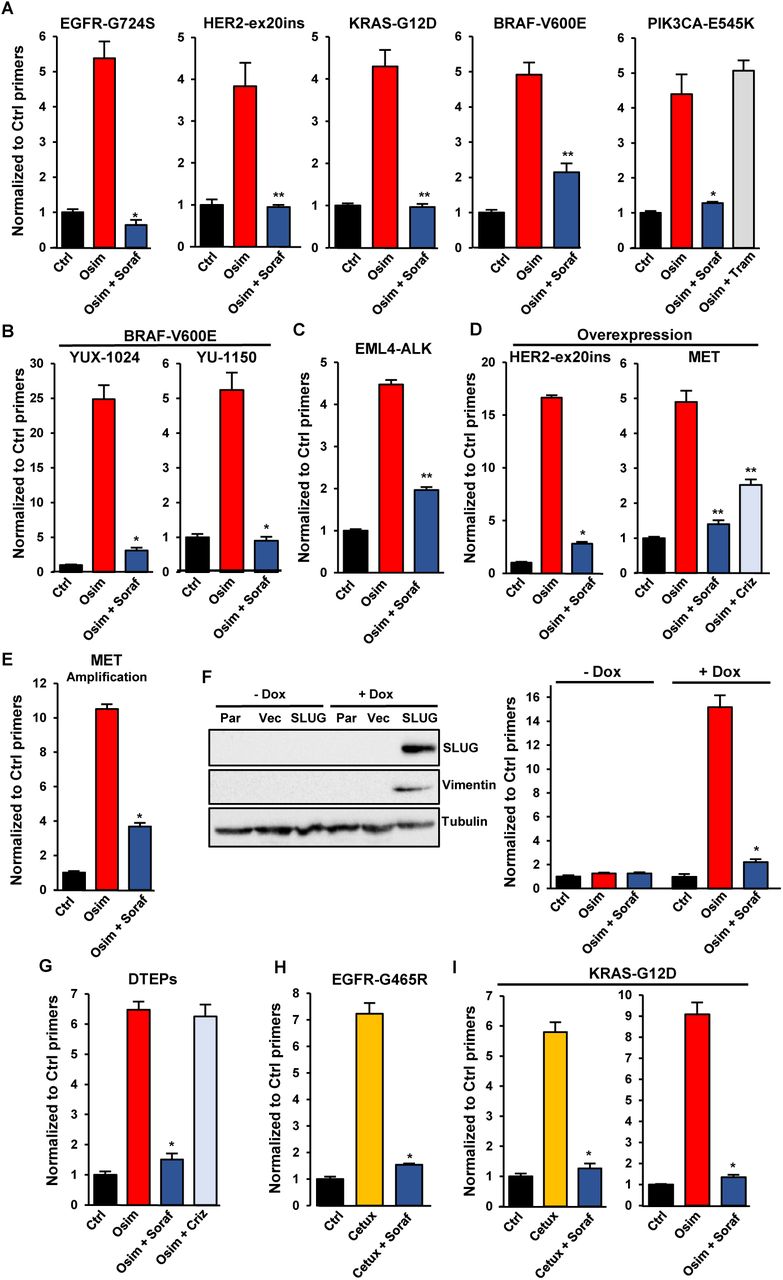
Figure Lengend Snippet: A. CRISPR-barcoding was used to generate PC9 cell subpopulations containing EGFR-G724S, HER2-ex20ins (HER2-A775insV-G776C), KRAS-G12D, BRAF-V600E or PIK3CA-E545K mutations, and the cells were treated with or without osimertinib (0,1 μM), alone or in combination with sorafenib (5 μM) or trametinib (10 nM; Tram) for 7 (BRAF-V600E), 10 (EGFR-G724S and KRAS-G12D), 15 (PIK3CA-E545K) or 20 (HER-ex20ins) days. The proportions of the mutant barcodes were assessed by qPCR from genomic DNA and normalized using EGFR_Ctrl primers. Mean ±SEM (n=4) of one representative of at least three experiments. *p < 0.05 and **p < 0.01 (Mann-Whitney test). B. The BRAF-V600E mutation was introduced by CRISPR/Cas9 in YUX-1024 and YU-1150 PDCs, followed by selection in the presence of osimertinib (0,1 μM). The mutant cells were mixed with parental cells (1 to 100 ratio), and the resulting cell population was treated with osimertinib (0,1 μM, 7 days) alone or in combination with sorafenib (5 μM). The proportion of the BRAF-V600E barcode was measured by qPCR. Mean ±SEM (n=4) of one representative of three experiments. C. The EML4-ALK chromosomal inversion was induced by CRISPR/Cas9 in a small subpopulation of PC9 cells. The proportion of mutant cells was assessed after treatment in the presence or the absence of osimertinib (0,1 µM, 10 days), alone or in combination with sorafenib (5 µM). D. Overexpression of HER2-A775insYVMA (HER-ex20ins) in PC9 cells was induced by transduction with a lentiviral vector. MET overexpression was induced using a dCas9 activator system through a sgRNA targeting the MET gene, followed by two-week selection in the presence of osimertinib (0,1 μM). The cells overexpressing HER-ex20ins or MET were mixed with parental PC9 cells (1 to 100 ratio) and treated with osimertinib (0,1 μM) alone or in combination with sorafenib (5 μM) or crizotinib (1 µM; Criz) for 10 (HER-ex20ins) or 15 (MET) days. The proportion of cells overexpressing HER-ex20ins or MET was assessed by qPCR from genomic DNA using vector specific primers and normalized using EGFR_Ctrl primers. Mean ±SEM (n=4 for HER2-ex20ins; n=5 for MET) of one representative of three experiments. E. EGFR-TKI resistant HCC827-GR6 cells were transduced with a lentiviral vector and mixed with parental HCC827 in a 1 to 100 ratio. The cells were then treated for 6 days with osimertinib (0,1 µM) alone or in combination with sorafenib (5 µM), and the proportion of HCC827-GR6 cells was measured by qPCR using vector specific primers. The mean ±SEM (n=4) of one representative of three different experiments is represented. F. PC9 cells were transduced with an empty lentiviral vector (Vec) or a vector for inducible expression of the EMT transcription factor SLUG (SLUG), followed by a 7 day treatment in the presence or the absence of doxycycline (1 µg/ml). Immunoblot (left panel) was performed using anti-SLUG, anti-vimentin and anti-tubulin antibodies. Parental PC9 (Par) were used as negative control. Cells containing the SLUG vector, pre-treated or not with doxycycline for at least one week, were mixed with parental PC9 (1 to 100 ratio) and treated for 7 days with osimertinib (0,1 µM) alone or in combination with sorafenib (5 µM). The proportion of cells containing the lentiviral vector was assessed by qPCR. Mean ±SEM (n=4) of one representative of three experiments. G. PC9 cells labeled with a control lentivirus were selected in the presence of osimertinib (0,1 µM) for 3 weeks to obtain a population of drug-tolerant expanded persisters (DTEPs), then mixed with parental cells (1 to 100 ratio). The proportion of DETPS was assessed by qPCR from genomic DNA using primers specific to the lentiviral vector after a 15-day treatment with osimertinib (0,1 µM) alone or in combination with sorafenib (5 µM) or crizotinib (0.5 µM). The mean ±SEM (n=4) of one representative of three experiments is represented. H-I. The EGFR-G465R (H) or KRAS-G12D (I) mutations were introduced by CRISPR-barcoding in a subpopulation of LIM1215 CRC cells, and the proportion of mutant cells was assessed after 6 days in the presence or the absence of cetuximab (20 µg; Cetux) or osimertinib (1 µM), alone or in combination with sorafenib (5 μM). The mean ±SEM (n=3 for EGFR-G465R; n=4 for KRAS-G12D) of one representative of three different experiments is represented.
Article Snippet: Flag-tagged wt and Ex19Del human EGFR constructs in the lentiviral VIRSP vector were generated by PCR with Herculase II Fusion DNA Polymerase (Agilent technologies) from EGFR WT (a gift from Matthew Meyerson, Addgene plasmid # 11011) ( ) and
Techniques: CRISPR, Mutagenesis, MANN-WHITNEY, Selection, Over Expression, Transduction, Plasmid Preparation, Expressing, Western Blot, Negative Control, Labeling, Control

Journal: bioRxiv
Article Title: Prolonging lung cancer response to EGFR inhibition by targeting the selective advantage of resistant cells
doi: 10.1101/2023.06.19.545595
Figure Lengend Snippet: A. PC9 cells were treated for 10 to 60 minutes (min) with sorafenib (5 µM) or the MEK inhibitor trametinib (50 nM,), followed by immunoblot using the indicated antibodies. B. YUX-1024 and YU-1150 PDCs were treated for 2h with sorafenib (5 µM), osimertinib (0,1 µM), the MNK inhibitor eFT-508 (1 µM; eFT) or trametinib (50 nM; Tram), and immunoblot was performed using the indicated antibodies. C. PC9 cells transduced with a lentiviral vector for inducible expression of a constitutively active form of Flag-tagged MNK2 (CA-MNK2) were pre-treated with or without doxycycline (0,1 μg/ml; Dox) for 12h, followed by 1h treatment with sorafenib (5, 10 or 20 µM), eFT-508 (20 μM, positive control) or trametinib (1 μM, negative control). Immunoblot was performed using the indicated antibodies. D. Flag-tagged eIF4E was immunoprecipitated from transfected 293T cells and in vitro kinase assay was performed using recombinant active MNK2 (rMNK2) in the presence or the absence of the indicated concentrations of sorafenib, trametinib or eFT-508. Immunoblot was performed using anti-phospho-eIF4E, anti-MNK2 and anti-Flag antibodies. E. PC9 cells were treated with sorafenib (5 µM) or trametinib (50 nM) for 6h, followed by immunoblot using the indicated antibodies. F. PC9 cells were treated with or without sorafenib (5 µM) for 24, 48 or 72h, followed by immunoblot using the indicated antibodies. G. YU-1150 and YUX-1024 PDCs were treated with or without sorafenib (5 µM) for 3 days, followed by immunoblot using the indicated antibodies. H. EGFR-T790M CRISPR-barcoded PC9 cells were treated with gefitinib (1 µM) alone, or with sorafenib (5 µM) or a combination of the three inhibitors napabucasin (0.5 µM, STAT3 inhibitor), S63845 (0.1 µM, MCL1 inhibitor) and eFT-508 (1 µM; iESM) in 5% FBS medium for 5 days. The proportion of the EGFR-T790M barcode was measured by qPCR from genomic DNA and normalized using EGFR_Ctrl primers. Mean ±SEM (n=5) of one representative of three experiments. *p < 0.05 (Mann-Whitney test).
Article Snippet: Flag-tagged wt and Ex19Del human EGFR constructs in the lentiviral VIRSP vector were generated by PCR with Herculase II Fusion DNA Polymerase (Agilent technologies) from EGFR WT (a gift from Matthew Meyerson, Addgene plasmid # 11011) ( ) and
Techniques: Western Blot, Transduction, Plasmid Preparation, Expressing, Positive Control, Negative Control, Immunoprecipitation, Transfection, In Vitro, Kinase Assay, Recombinant, CRISPR, MANN-WHITNEY

Journal: bioRxiv
Article Title: Prolonging lung cancer response to EGFR inhibition by targeting the selective advantage of resistant cells
doi: 10.1101/2023.06.19.545595
Figure Lengend Snippet: A. Time-course effects of sorafenib (5 µM) in PC9 cells. Immunoblot was performed using the indicated antibodies. Anti-eIF4E was used as a loading control. B. YUX-1024 and YU-1150 PDCs were treated with sorafenib (5 µM) for 5 days, followed by immunoblot using anti EGFR and anti-tubulin antibodies. C. PC9 cells were transduced with a lentiviral vector containing Flag-tagged EGFR-Ex19Del and the green fluorescent protein (GFP), separated by the T2A self-cleaving peptide and under the control of the PGK promoter. Two different clones were isolated and treated for 3 days in the presence or the absence of sorafenib (5 µM). The expression of EGFR and GFP was measured by immunoblot (upper panel) and FACS (lower panel), respectively. D. PC9 cells were transduced with lentiviral vectors containing either Ex19Del-mutant or wt Flag-tagged EGFR, and two clones per condition were isolated. The clones were treated in the presence or the absence of sorafenib (5 µM) for 3 days, and immunoblot was performed using anti-Flag and anti-tubulin antibodies. E. PC9 cells were treated with sorafenib (5 µM) alone or in combination with different concentrations of chloroquine (ChQ) for 3 days, followed by immunoblot with anti-EGFR and anti-tubulin antibodies. F. PC9 cells containing the EGFR-T790M CRISPR-barcode were treated with gefitinib (1 µM) alone or in combination with sorafenib (5 µM), with or without chloroquine (20 µM) for 4 days. Genomic DNA was derived and the proportion of the EGFR-T790M barcode was measured by qPCR and normalized using the EGFR_Ctrl primers. The mean ±SEM (n=5) of one representative of three experiments is represented. **p < 0.01 (Mann-Whitney test).
Article Snippet: Flag-tagged wt and Ex19Del human EGFR constructs in the lentiviral VIRSP vector were generated by PCR with Herculase II Fusion DNA Polymerase (Agilent technologies) from EGFR WT (a gift from Matthew Meyerson, Addgene plasmid # 11011) ( ) and
Techniques: Western Blot, Control, Transduction, Plasmid Preparation, Clone Assay, Isolation, Expressing, Mutagenesis, CRISPR, Derivative Assay, MANN-WHITNEY

Journal: bioRxiv
Article Title: Prolonging lung cancer response to EGFR inhibition by targeting the selective advantage of resistant cells
doi: 10.1101/2023.06.19.545595
Figure Lengend Snippet: A. Gene set enrichment analysis (GSEA) of genes up-regulated by EGFR-TKIs in NSCLC cells (KOBAYASHI_EGFR_SIGNALING_24HR_UP signature), performed on gene array data obtained from PC9 cells treated with osimertinib (1 µM) or sorafenib (5 µM), alone or in combination (Combo) for two days. Enrichment scores (ES) and p values are reported. B. The data described in A were analyzed using our osimertinib-sorafenib combination signature (COMBO_UP). C. Osimertinib sensitive and resistant PC9 cells were treated with osimertinib (1 µM) and sorafenib (5 µM), alone or in combination, for 3 days, followed by immunoblot using the indicated antibodies. D. PC9 cells containing highly complex CRISPR-barcodes in the AAVS1 locus were treated for two weeks with osimertinib (1 µM) and sorafenib (5 µM), alone or in combination (n=4 per condition). Barcodes enriched at least 5-fold over the control in 4 or 3 replicates are shown. E. Barcode heatmap and Ward’s hierarchical clustering of the four replicates per condition of the experiment described in C . F. Correlation matrix of the data shown in D . G. Pearson correlation of the barcode distribution in control versus osimertinib or control versus combination treated cells. The coefficients of determination (R 2 ) and the p value (Mann-Whitney test) are indicated.
Article Snippet: Flag-tagged wt and Ex19Del human EGFR constructs in the lentiviral VIRSP vector were generated by PCR with Herculase II Fusion DNA Polymerase (Agilent technologies) from EGFR WT (a gift from Matthew Meyerson, Addgene plasmid # 11011) ( ) and
Techniques: Western Blot, CRISPR, Control, MANN-WHITNEY

Journal: bioRxiv
Article Title: Prolonging lung cancer response to EGFR inhibition by targeting the selective advantage of resistant cells
doi: 10.1101/2023.06.19.545595
Figure Lengend Snippet: A. A PC9 mass population containing small pools (1 to 1000 ratio each) of EGFR-C797S (expressing GFP), KRAS-G12D (expressing β-galactosidase) and PIK3CA-E545K (expressing mCherrry) osimertinib-resistant cells were subcutaneously injected in the right and left flanks of SCID mice. Once the tumors reached a mean volume of about 200 mm 3 , the mice were sacrificed (Ctrl) or treated for 4 weeks with osimertinib (5 mg/kg) alone or in combination with sorafenib (60 mg/kg; Combo). 3D-imaging through iDISCO technology was performed to visualize the subpopulations of resistant cells. To maintain a similar size of the samples from different conditions, the tumors from osimertinib treated mice were cut in two. B. A mass population of PC9 cells containing a small pool of cells bearing the EGFR-C797S mutation generated by CRISPR-barcoding was injected in the right and left flanks of SCID mice. Once the tumors were palpable (arrow), the mice were randomized and treated with or without osimertinib (5 mg/kg) and sorafenib (60 mg/kg), alone or in combination, and the volume of the tumors was measured by caliper. The mean tumor volumes ± SEM are represented (n=5 mice per group). C. YUX-1024 PDCs containing a subpopulation (1 to 200 ratio) of BRAF-V600E resistant cells expressing GFP were subcutaneously injected in the right and left flanks of SCID mice. Once the tumors reached a mean volume of about 200 mm 3 , the mice were sacrificed (Ctrl) or treated for 4 weeks with osimertinib (10 mg/kg) alone or in combination with sorafenib (60 mg/kg), followed by 3D-imaging. Tumors from osimertinib-treated tumors were cut in two before staining to ensure comparable size of the samples. D. A mass population of YUX-1024 PDCs containing a pool of BRAF-V600E cells (1 to 200 ratio) was injected in the right and left flanks of SCID mice. When the tumors reached a mean volume of about 200 mm 3 , the mice were treated with vehicle, osimertinib (10 mg/kg), sorafenib (60 mg/kg) or a combination of the two inhibitors. The mean tumor volumes ± SEM are represented (n=6 mice for the control, n=8 for the other groups). E. Kaplan-Meier diagram of the experiment illustrated in D . The mice were sacrificed when the volume of at least one of the tumors exceeded 800 mm 3 .
Article Snippet: Flag-tagged wt and Ex19Del human EGFR constructs in the lentiviral VIRSP vector were generated by PCR with Herculase II Fusion DNA Polymerase (Agilent technologies) from EGFR WT (a gift from Matthew Meyerson, Addgene plasmid # 11011) ( ) and
Techniques: Expressing, Injection, Imaging, Mutagenesis, Generated, CRISPR, Staining, Control

Journal: bioRxiv
Article Title: Prolonging lung cancer response to EGFR inhibition by targeting the selective advantage of resistant cells
doi: 10.1101/2023.06.19.545595
Figure Lengend Snippet: A. A PC9 mass population containing small pools of EGFR-C797S, KRAS-G12D and PIK3CA-E545K CRISPR-barcoded or HER2-ex20ins overexpressing cells was injected in the right and left flanks of SCID mice. Once the tumors reached a mean volume of about 100 mm 3 , the mice were randomized and treated with either vehicle or osimertinib (5 mg/kg), alone or in combination with sorafenib (60 mg/kg) and the volume of the tumors was measured by caliper. The mean tumor volumes ± SEM are shown (n=6 mice for the control, n=10 mice for the other groups). B. Kaplan-Meier diagram of the experiment shown in A . The mice were sacrificed when the volume of at least one of the tumors exceeded 800 mm 3 . C. GSEA of the genes up-regulated by osimertinib, sorafenib or the combination in PC9 cells based on an inflammatory response signature. D. Mouse BEM-5 cells addicted to mutant EGFR were injected in the right and left flanks of syngeneic BALB/c mice. When the tumors reached a mean volume of about 50 mm 3 , the mice were treated for 10 days with vehicle, osimertinib (20 mg/kg), sorafenib (60 mg/kg) or a combination of the two inhibitors, followed by IHC analysis using the indicated antibodies. Images representative of three different tumors/mice per condition are shown. E. BEM-5 cells were injected in the right and left flanks of BALB/c mice. Once the tumors reached a mean volume of about 50 mm 3 , the mice were randomized and treated with either vehicle or osimertinib (20 mg/kg) alone or in combination with sorafenib (60 mg/kg). The mean tumor volumes ± SEM are shown (n=5 mice for control, n=6 mice for osimertinib and sorafenib, n=16 mice for the combination). F. Kaplan-Meier diagram of the experiment shown in E. The mice were sacrificed when the volume of at least one of the tumors exceeded 800 mm 3 .
Article Snippet: Flag-tagged wt and Ex19Del human EGFR constructs in the lentiviral VIRSP vector were generated by PCR with Herculase II Fusion DNA Polymerase (Agilent technologies) from EGFR WT (a gift from Matthew Meyerson, Addgene plasmid # 11011) ( ) and
Techniques: CRISPR, Injection, Control, Mutagenesis
Journal: Cancer Science
Article Title: Lamellarin 14, a derivative of marine alkaloids, inhibits the T790M/C797S mutant epidermal growth factor receptor
doi: 10.1111/cas.14839
Figure Lengend Snippet: Lamellarin (Lam)14 reduces the viability of Ba/F3 cells expressing epidermal growth factor receptors (EGFRs) with in‐frame deletion within exon 19 (del ex19)/T790M or del ex19/T790M/C797S EGFR‐tyrosine kinase inhibitor‐resistant mutations. A‐C, MTT assay was used to determine the viability of Ba/F3 cells expressing WT or mutant EGFRs treated with Lam14 or osimertinib for 4 days in the presence or absence of interleukin‐3 (IL‐3; 10 ng/mL). Ba/F3 cells expressing del ex19/T790M or del ex19/T790M/C797S EGFR mutations were treated with the indicated concentration of osimertinib (A) or Lam14 (B) in the presence or absence of IL‐3 (10 ng/mL) (mean ± SD [n ≥ 3]). C, IC 50 values of osimertinib and Lam14 in Ba/F3 cell lines are indicated. ND, not determined. D, Ba/F3 cells expressing WT EGFR or Ba/F3 del ex19/T790M/C797S cells were treated with the indicated concentration of Lam14 in the presence or absence of IL‐3 (10 ng/mL) (mean ± SD [n = 3]). In Ba/F3 WT cells, EGF (10 ng/mL) was added instead of IL‐3
Article Snippet: Ba/F3 cells were provided by RIKEN BioResource Research Center and maintained in RPMI‐1640 medium containing 10% FBS, 10 ng/mL recombinant mouse IL‐3 (PeproTech), and penicillin/streptomycin. pBABE‐EGFR L858R (#11012), pBABE‐EGFR del exon19 (#32062), pBABE‐EGFR L858R/T790M (#32073), and
Techniques: Expressing, MTT Assay, Mutagenesis, Concentration Assay
![Lamellarin (Lam)14 inhibits cell viability and epidermal growth factor receptor (EGFR) signaling in PC‐9 cells expressing EGFR‐tyrosine kinase inhibitor‐resistant mutant EGFRs. A–C, Parental PC‐9 cells, mutant EGFR‐expressing PC‐9 cells (in‐frame deletion within exon 19 [del ex19]/T790M, L858R/T790M, del ex19/T790M/C797S, L858R/T790M/C797S), and A549 cells expressing endogenous WT EGFR were treated with the indicated concentration of gefitinib (A), osimertinib (B), or Lam14 (C) for 4 days (mean ± SD [n = 3]). Cell viability was measured using the MTT assay. D, IC 50 values of gefitinib, osimertinib, and Lam14 in PC‐9 cell lines are indicated. E, F, PC‐9 cells and mutant EGFR‐expressing PC‐9 cells (del ex19/T790M, L858R/T790M, del ex19/T790M/C797S, or L858R/T790M/C797S) were treated with Lam14 (E) or osimertinib (F) for 4 hours. Phosphorylation levels of EGFR and its downstream molecules were analyzed by western blotting using Abs for indicated proteins. pAKT, AKT phosphorylated at S473; pEGFR, EGFR phosphorylated at Y1068; pERK, ERK1/2 phosphorylated at T202/Y204](https://pub-med-central-images-cdn.bioz.com/pub_med_central_ids_ending_with_8975/pmc08088975/pmc08088975__CAS-112-1963-g001.jpg)
Journal: Cancer Science
Article Title: Lamellarin 14, a derivative of marine alkaloids, inhibits the T790M/C797S mutant epidermal growth factor receptor
doi: 10.1111/cas.14839
Figure Lengend Snippet: Lamellarin (Lam)14 inhibits cell viability and epidermal growth factor receptor (EGFR) signaling in PC‐9 cells expressing EGFR‐tyrosine kinase inhibitor‐resistant mutant EGFRs. A–C, Parental PC‐9 cells, mutant EGFR‐expressing PC‐9 cells (in‐frame deletion within exon 19 [del ex19]/T790M, L858R/T790M, del ex19/T790M/C797S, L858R/T790M/C797S), and A549 cells expressing endogenous WT EGFR were treated with the indicated concentration of gefitinib (A), osimertinib (B), or Lam14 (C) for 4 days (mean ± SD [n = 3]). Cell viability was measured using the MTT assay. D, IC 50 values of gefitinib, osimertinib, and Lam14 in PC‐9 cell lines are indicated. E, F, PC‐9 cells and mutant EGFR‐expressing PC‐9 cells (del ex19/T790M, L858R/T790M, del ex19/T790M/C797S, or L858R/T790M/C797S) were treated with Lam14 (E) or osimertinib (F) for 4 hours. Phosphorylation levels of EGFR and its downstream molecules were analyzed by western blotting using Abs for indicated proteins. pAKT, AKT phosphorylated at S473; pEGFR, EGFR phosphorylated at Y1068; pERK, ERK1/2 phosphorylated at T202/Y204
Article Snippet: Ba/F3 cells were provided by RIKEN BioResource Research Center and maintained in RPMI‐1640 medium containing 10% FBS, 10 ng/mL recombinant mouse IL‐3 (PeproTech), and penicillin/streptomycin. pBABE‐EGFR L858R (#11012), pBABE‐EGFR del exon19 (#32062), pBABE‐EGFR L858R/T790M (#32073), and
Techniques: Expressing, Mutagenesis, Concentration Assay, MTT Assay, Phospho-proteomics, Western Blot
![Lamellarin (Lam)14 suppresses tumor growth and epidermal growth factor receptor (EGFR) phosphorylation in EGFR in‐frame deletion within exon 19 (del ex19)/T790M/C797S‐expressing PC‐9 cells in vivo. A, PC‐9 del ex19/T790M/C797S cells were s.c. injected into BALB/c nu/nu mice. One week after the implantation, the mice were randomized into control (PBS) or treatment groups (5 or 10 mg/kg Lam14). PBS or Lam14 was i.p. injected once a day for 17 days. Tumor volume (mm 3 ) was calculated as length × width 2 / 2 (mean ± SD [n ≥ 9]). Change in tumor size on day 17 was calculated using one‐way ANOVA. NS, not significant. ** P < .01. B, Body weights of mice were measured every day (mean ± SD [n = 5]). C, D, Levels of EGFR phosphorylation in tumors were analyzed by immunohistochemistry (C), and at least eight independent view fields for each of the four tumors were analyzed using ImageJ and Student's t test. NS, not significant. * P < .05. Scale bars = 50 μm](https://pub-med-central-images-cdn.bioz.com/pub_med_central_ids_ending_with_8975/pmc08088975/pmc08088975__CAS-112-1963-g002.jpg)
Journal: Cancer Science
Article Title: Lamellarin 14, a derivative of marine alkaloids, inhibits the T790M/C797S mutant epidermal growth factor receptor
doi: 10.1111/cas.14839
Figure Lengend Snippet: Lamellarin (Lam)14 suppresses tumor growth and epidermal growth factor receptor (EGFR) phosphorylation in EGFR in‐frame deletion within exon 19 (del ex19)/T790M/C797S‐expressing PC‐9 cells in vivo. A, PC‐9 del ex19/T790M/C797S cells were s.c. injected into BALB/c nu/nu mice. One week after the implantation, the mice were randomized into control (PBS) or treatment groups (5 or 10 mg/kg Lam14). PBS or Lam14 was i.p. injected once a day for 17 days. Tumor volume (mm 3 ) was calculated as length × width 2 / 2 (mean ± SD [n ≥ 9]). Change in tumor size on day 17 was calculated using one‐way ANOVA. NS, not significant. ** P < .01. B, Body weights of mice were measured every day (mean ± SD [n = 5]). C, D, Levels of EGFR phosphorylation in tumors were analyzed by immunohistochemistry (C), and at least eight independent view fields for each of the four tumors were analyzed using ImageJ and Student's t test. NS, not significant. * P < .05. Scale bars = 50 μm
Article Snippet: Ba/F3 cells were provided by RIKEN BioResource Research Center and maintained in RPMI‐1640 medium containing 10% FBS, 10 ng/mL recombinant mouse IL‐3 (PeproTech), and penicillin/streptomycin. pBABE‐EGFR L858R (#11012), pBABE‐EGFR del exon19 (#32062), pBABE‐EGFR L858R/T790M (#32073), and
Techniques: Phospho-proteomics, Expressing, In Vivo, Injection, Control, Immunohistochemistry
Journal: Oncogenesis
Article Title: Oncogenic MCT-1 activation promotes YY1-EGFR-MnSOD signaling and tumor progression.
doi: 10.1038/oncsis.2017.13
Figure Lengend Snippet: Figure 2. MCT-1 overexpression protects cells against oxidative stress via YY1. MCF-10A cells (control and MCT-1) with YY1 knockdown (shYY1) or scrambled knockdown were studied. (a) EGFR and p53 expression were analyzed in cells with different MCT-1 and YY1 levels. The protein amounts were normalized to GAPDH and compared with scrambled control (lane 1). (b) Relative EGFR promoter activity is indicated. (c) Relative EGFR mRNA level is shown. (d) Relative p53 promoter activity is shown. (e) After the cells were exposed to 100 μM H2O2 for 24 h, apoptotic events were evaluated using FITC-Annexin V staining and propidium iodide (PI) counter staining, followed by flow cytometry analysis. The data represent the mean ± s.d. (n = 3). ***Po0.001.
Article Snippet: The pBABE plasmid carrying
Techniques: Over Expression, Control, Knockdown, Expressing, Activity Assay, Staining, Cytometry

Journal: Oncogenesis
Article Title: Oncogenic MCT-1 activation promotes YY1-EGFR-MnSOD signaling and tumor progression.
doi: 10.1038/oncsis.2017.13
Figure Lengend Snippet: Figure 3. MCT-1 and EGFR co-operatively protect cells against oxidative stress. MCF-10A (a–c) and A549 cells (d, e) with different levels of MCT-1 expression were studied. (a) The expression and phosphorylation levels of EGFR, p53 and H2AX were studied after H2O2 exposure for 1 h. The protein amounts were normalized to GAPDH, and the phosphorylated EGFR levels were normalized to total EGFR before comparison with the comparative control (lane 1). (b) The cells (control, MCT-1) with or without EGFR co-expression were exposed to H2O2 for 24 h or pre- treated with 5 μM AG1478 for 1 h. Flow cytometry was used to analyze the oxidative cell death after FITC-Annexin V staining and propidium iodide (PI) counter staining. (c) ROS generation in the cells overexpressing wild-type EGFR (EGFRwt) or mutant EGFR (L858R) was detected by a DCFDA-cellular ROS method. (d) Intracellular ROS levels were analyzed and compared in different cellular contents (MCT-1 overexpressing vs vector control and MCT-1 silencing (shMCT-1) vs. scrambled knockdown). (e) Mitochondrial superoxide levels were examined and quantified in different MCT-1 contents using mitochondrial superoxide indicator (MitoSOX) and flow cytometry analysis. Data represent the mean ± s.d. (n = 3). *Po0.05; **Po0.01; ***Po0.001.
Article Snippet: The pBABE plasmid carrying
Techniques: Expressing, Phospho-proteomics, Comparison, Control, Flow Cytometry, Staining, Mutagenesis, Plasmid Preparation, Knockdown, Cytometry

Journal: Oncogenesis
Article Title: Oncogenic MCT-1 activation promotes YY1-EGFR-MnSOD signaling and tumor progression.
doi: 10.1038/oncsis.2017.13
Figure Lengend Snippet: Figure 4. MnSOD is induced by MCT-1 overexpression, p53 knockdown and EGFR activation. (a) MnSOD expression was examined in MCF-10A cells (control and MCT-1) with (shp53) or without (scramble) p53 depletion. (b) Cellular ROS levels were analyzed in MCF-10A cells with different conditions of p53 and MCT-1 expression upon DMSO or AG1478 treatment. Data represent the mean ± s.d. (n = 3). **Po0.01; ***Po0.001. (c) MnSOD levels were characterized in the H1299 cells (control and MCT-1) without (pCMV) or with p53 re-expression (pCMV p53). (d) The EGFR phosphorylation and MnSOD levels were assessed when H1299 cells were introducing empty vector, wild-type EGFR and EGFR-activating mutants (L858R and exon19 DEL). (e) MDA-MB231 cells with or without MCT-1 overexpression were assayed. (f) MDA-MB231 cells with or without MCT-1 knockdown were evaluated. The protein amounts were normalized to β-actin or GAPDH, and the phosphorylated EGFR levels were normalized to total EGFR levels before comparison with the comparative controls (lane 1).
Article Snippet: The pBABE plasmid carrying
Techniques: Over Expression, Knockdown, Activation Assay, Expressing, Control, Phospho-proteomics, Plasmid Preparation, Comparison

Journal: Oncogenesis
Article Title: Oncogenic MCT-1 activation promotes YY1-EGFR-MnSOD signaling and tumor progression.
doi: 10.1038/oncsis.2017.13
Figure Lengend Snippet: Figure 5. MCT-1 induces MnSOD expression and promotes cancer cell invasion via the YY1 pathway. The A549 cancer cells were studied. (a) Subcellular distributions of MnSOD, NuMA, MCT-1 and β-actin in the nucleus, mitochondria (mito.) and cytoplasm were characterized in control (C) and MCT-1-overexpressing (M) cells. (b) MnSOD expression levels were examined in different MCT-1-silencing clones (#3–9 and #3–10) and scrambled knockdown (NC2). (c) The distribution of MnSOD and MCT-1 in the cytosolic and membrane fractions was studied. HSP70 and β1-integrin were the fraction markers. The amounts of cytosolic and membrane proteins were normalized to HSP70 and β1-integrin, respectively, and then compared with scrambled knockdown (lanes 1 and 3). (d) The effects of YY1 knockdown (shYY1) on the distribution of EGFR, MnSOD, MCT-1 and HSP70 in the cytosol and membrane were studied. The cytosol and membrane protein amounts were normalized to HSP70 and β1-integrin, respectively, and then compared with scrambled knockdown (lanes 1 and 3). (e) The effects of EGFR knockdown (shEGFR) on MnSOD and MCT-1 expression were assessed. The protein amounts were normalized to β-actin before comparison with scrambled control (lane 1). (f) The influence of DPI (an ROS inhibitor) on the expression of p47phox (active and inactive forms), YY1, EGFR, MnSOD and p53 was studied. The protein amounts were normalized to β-actin before comparison with the comparative control (lane 1). (g) Cell invasiveness affected by DPI treatment and YY1 knockdown was evaluated in different MCT-1 expression conditions. The data represent the mean ± s.d. (n = 3). ***Po0.001. (h) A proposed model of how MCT-1 overexpression promotes ROS generation and stimulates YY1-EGFR-MnSOD signaling, which can be suppressed by DPI and p53.
Article Snippet: The pBABE plasmid carrying
Techniques: Expressing, Control, Clone Assay, Knockdown, Membrane, Comparison, Over Expression

Journal: Oncogenesis
Article Title: Oncogenic MCT-1 activation promotes YY1-EGFR-MnSOD signaling and tumor progression.
doi: 10.1038/oncsis.2017.13
Figure Lengend Snippet: Figure 6. MCT-1 overexpression enhances A549 tumor progression. (a) Bioluminescent A549 cells were subcutaneously injected into nude mice, and tumors were allowed to develop for 8 weeks. Tumor expansion was detected by IVIS, and tumor weights were measured. (b) Photon flux detected by IVIS indicated tumorigenic outcomes at week 8. (c) Tumor growth was assessed weekly, and tumors in the xenograft mice injected with the control cells (n = 10) or MCT-1-overexpressing cells (n = 11) were compared. The data represent the mean ± s.d. *Po0.05; **Po0.01. (d) Immunohistochemistry results indicated the amounts of MCT-1, YY1, p-EGFR, MnSOD and p53 in the A549 tumors. Tumor angiogenesis (CD31, denoted by arrowheads) as well as the accumulation of myofibroblasts (α-SMA, indicated by asters) and tumor-promoting M2 macrophages (CD163, indicated by stars) were also characterized. Scale bar represents 50 μm.
Article Snippet: The pBABE plasmid carrying
Techniques: Over Expression, Injection, Control, Immunohistochemistry